07899 756585
A FUN EXAMPLE: suppose we want to sort these items into “things with exactly four legs” (Set A), and “the rest” (not in Set A):
John Venn, zebra, cat, octopus, tripod, chair.
One way to do this would be to split them into two lists, but a far prettier way is to arrange them into a Venn Diagram with one circle:
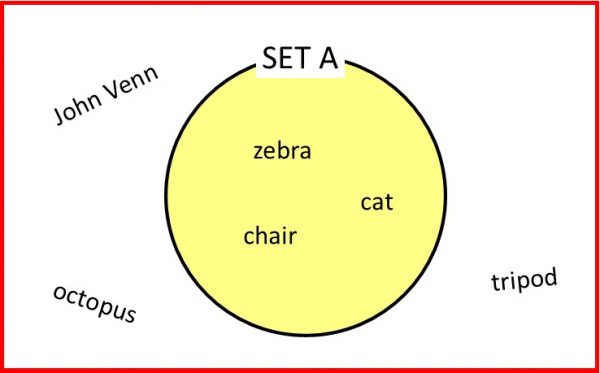
Zebra, chair and cat have exactly four legs each, and so they go inside the circle. But John Venn (2 legs), tripod (3 legs) and octopus (either 8 legs, or 2 legs + 6 arms, depending on who you ask!!?!) go outside the circle.
TWO CIRCLES: the Venn Diagram is most useful when there is more than one quality we’re looking at, such as this Venn which sorts some famous celebrities into subgroups depending on whether or not they are: Mathematicians (“MATH”), and English (“ENG”):
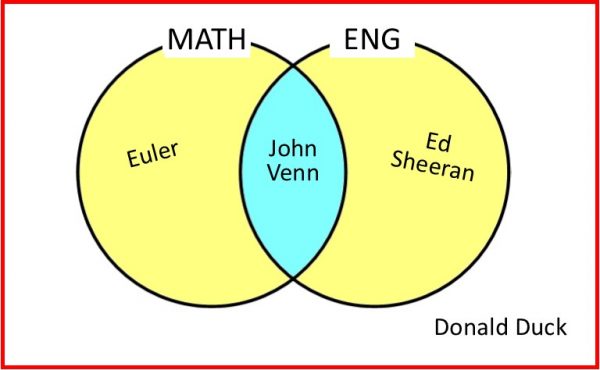
John Venn – being both English and a Mathematician – goes in the INTERSECTION (“overlap”) of both circles (as would Isaac Newton if we wished to place him in this diagram). Euler, being a Swiss not an English mathematician, is in set MATH but not ENG; Ed Sheeran is English but not a mathematician so goes in set ENG but not set MATH; and Donald Duck, a non-English non-mathematician, is around the outside.
Sorted!
THREE CIRCLES: Venn Diagrams are especially useful when sorting a group of objects according to three qualities. To illustrate this, here’s one which sorts some celebrities according to whether or not they are:
Human
Female
Cartoons.
For clarity, I’ve coloured the intersections of each pair of circles blue, and the intersection of all three circles pink.
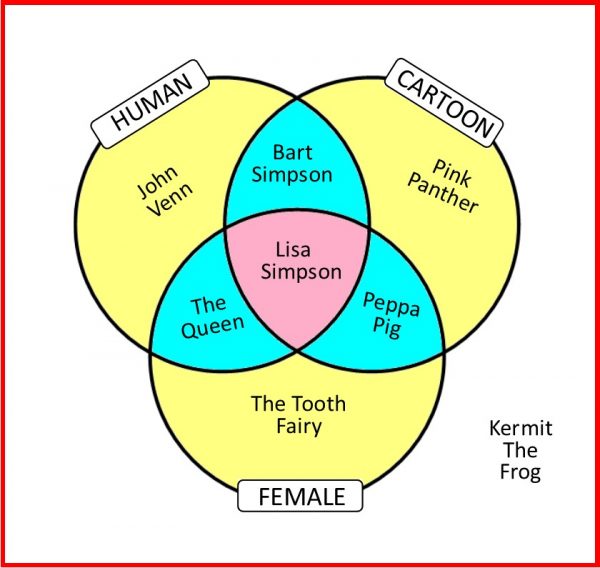
Although the diagram only features one character in each region, you could place any character somewhere on the diagram. Which region would you go in? And if you are with 7 or more friends, see if you can design a different Venn Diagram with three qualities so that each region has at least one of your friends in it. I had lots of fun designing this one!
ALERT! ALERT! EXPERTS ONLY: Venn Diagrams can also be drawn to sort objects according to four or even more different qualities, but you’ll find it’s impossible to display every possible combination of intersections using just circles: some more exotic curves are needed! So: in the Human / Cartoon / Female example above, if you also wanted to know whether or not, say, each character’s name contains the letter ‘E’, here’s one way you could draw the Venn Diagram, but upgrading the circles to four ellipses:
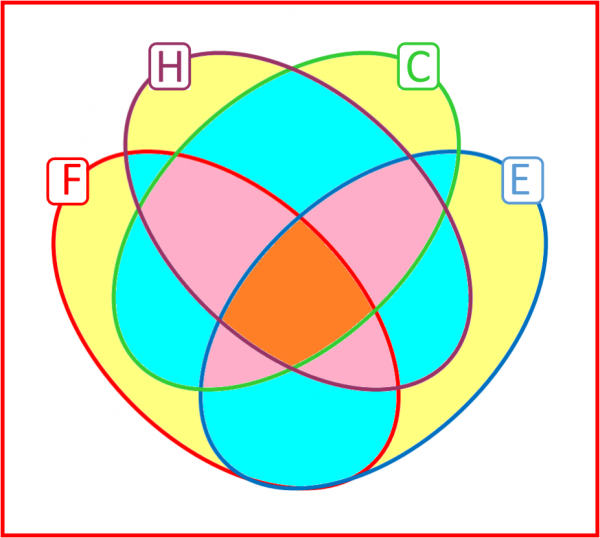
This time there are 16 (=2x2x2x2) different regions to fill, so I’ll leave you to find characters for each region! With every additional quality, the number of regions doubles again – so a 5-curve Venn Diagram will have 32 different regions. To see why this is, imagine you wanted to add another quality, say “have they ever appeared on a UK postage stamp?” In the new diagram, each of the previous regions must be combined both with and without the new quality, meaning twice as many regions in the new diagram.
Back to the 4-curve Venn: how many of the regions are inside 0, 1, 2, 3 and all 4 curves? I’ve coloured them differently to make it easier to count that there are 1, 4, 6, 4, 1 such regions respectively. Fans of Pascal’s Triangle will recognise this famous sequence!
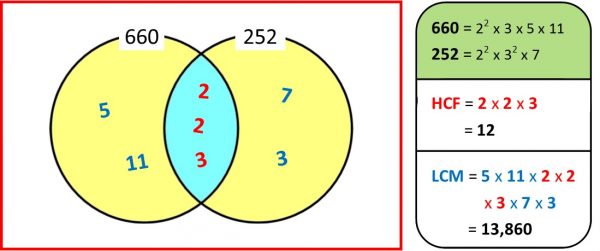
BONUS IDEA: suppose you want to find the HCF (Highest Common Factor) and LCM (Lowest Common Multiple) of two numbers, say 660 and 252. Break each down into the product of their prime factors (or get your Casio fx to do it for you: press 660 = SHIFT FACT), and arrange the factors into a Venn Diagram. The HCF is the product of the numbers in the INTERSECTION (overlap), and the LCM is the product of all the numbers in the UNION (both circles and the intersection):
FINAL THOUGHTS: John Venn lived from 1834 – 1923 (Wow! – maybe maths makes you live longer?). He was originally a priest before becoming a full time mathematician (someone who likes numbers, shapes and patterns), philosopher (“Who made God?”) and logician (true or false?: “This sentence is a lie”). He was married to Susanna and had one son: also John Venn (which must have made sorting his mail difficult). He was a keen supporter of votes for women, and won prizes for his home grown vegetables.
If you’ve enjoyed this blog, check out some of my other Superstars Of Maths, or why not contact me if there’s someone you’d like me to include in a future blog? John Venn: maths superstar, gentleman, scholar. You want objects organised into groups? John says: